

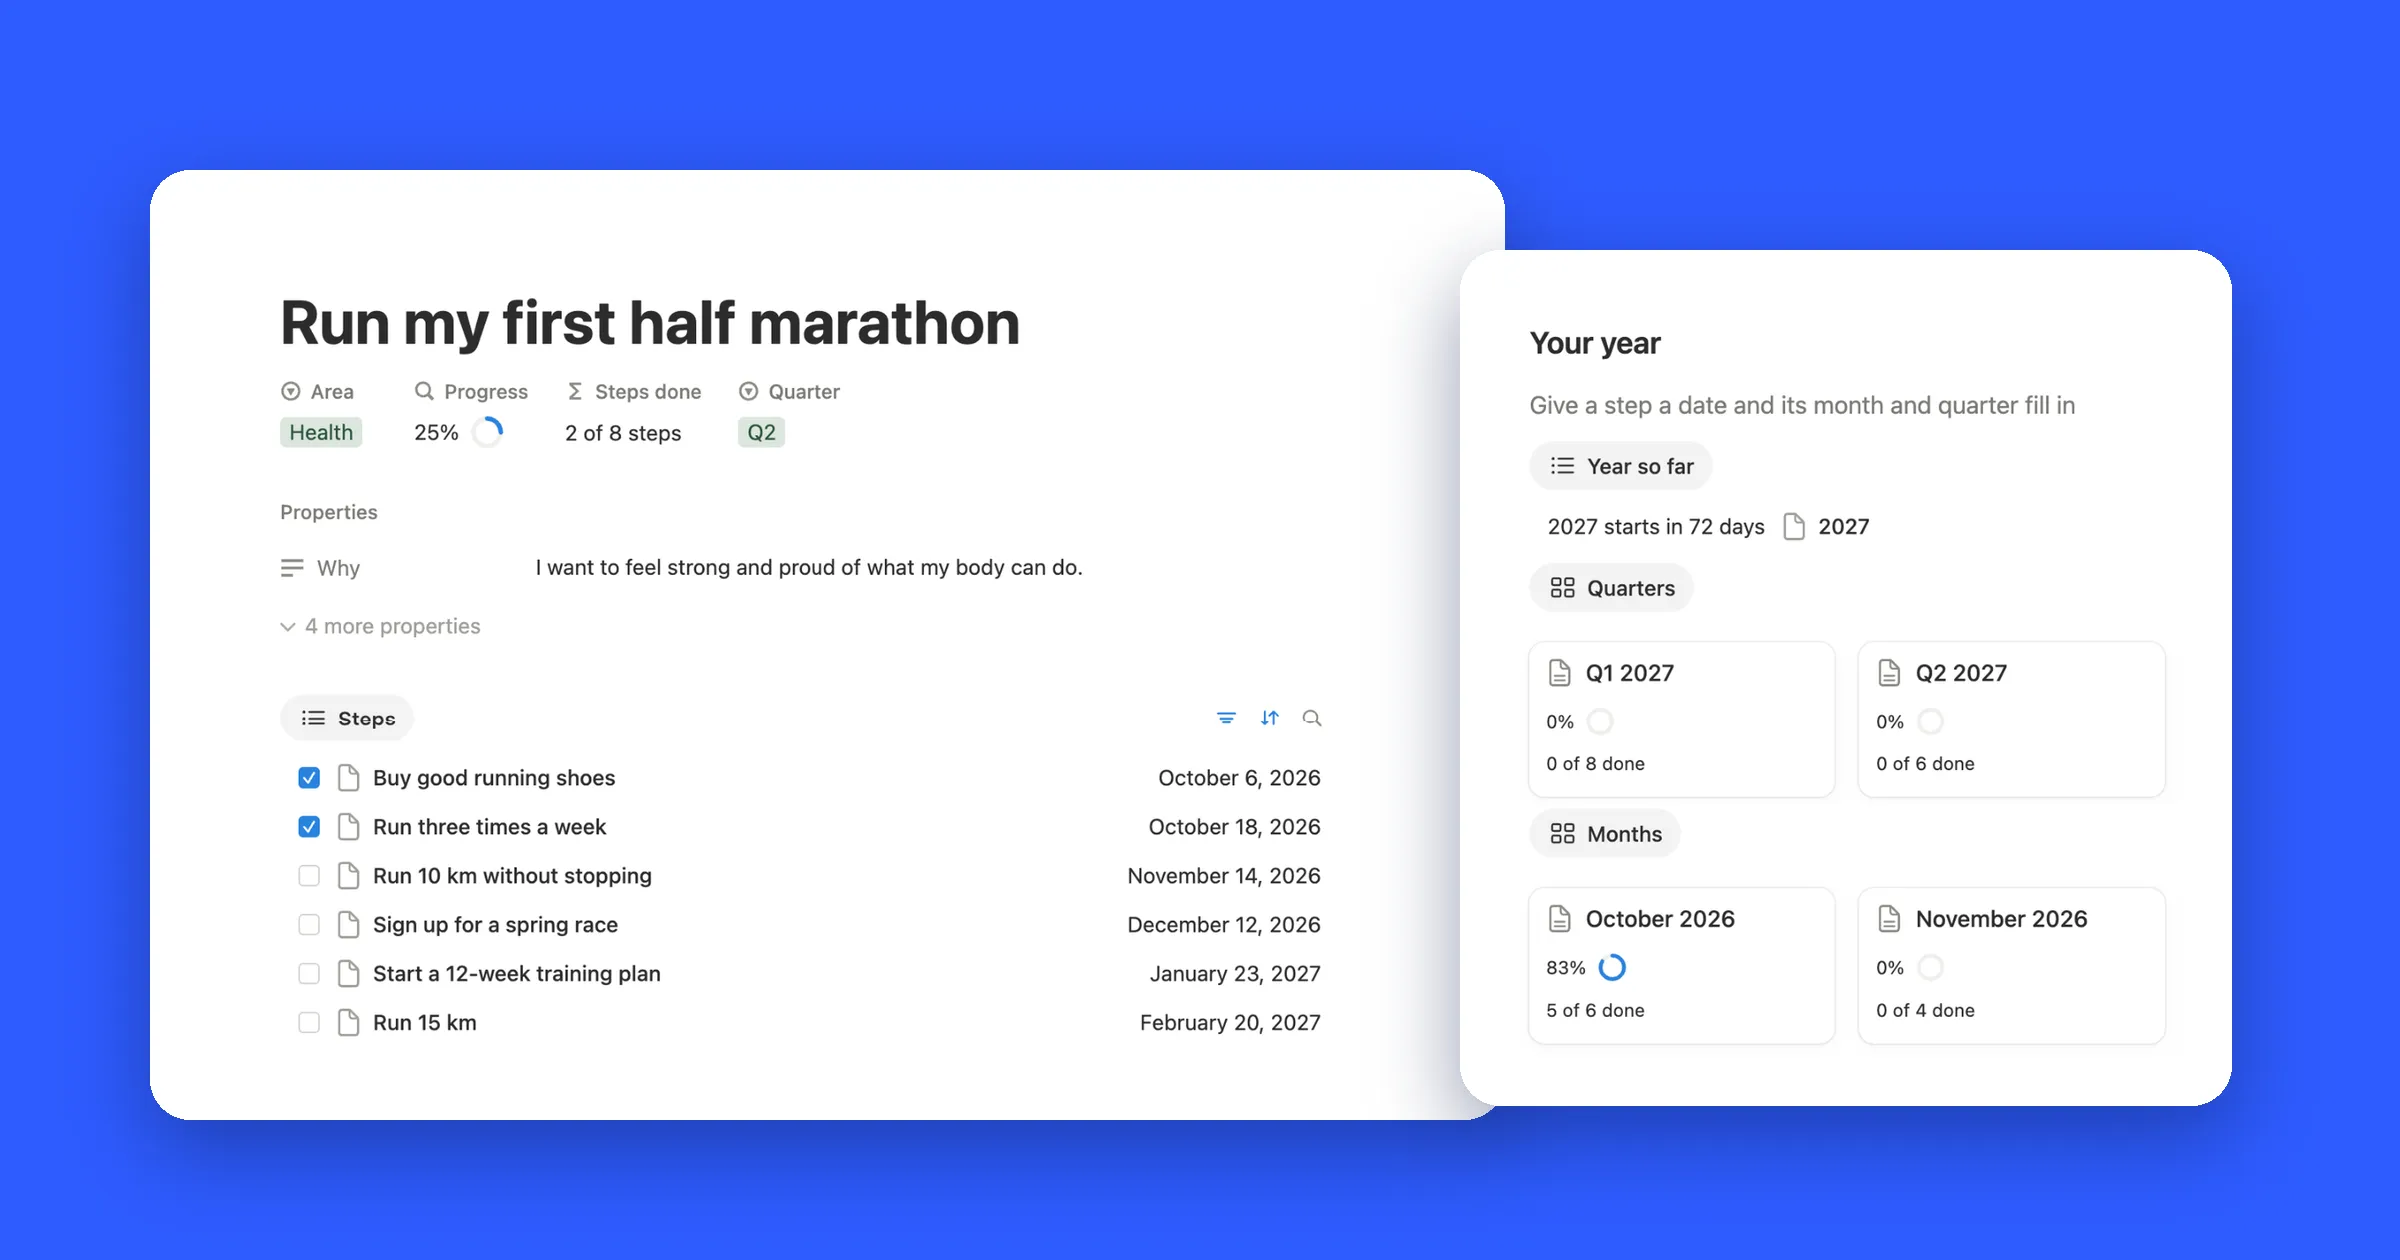

Try it: build your formula
Pick what counts as done and how the bar should look. The generator writes the formula, and you can tick boxes or change the numbers to see how it looks. Every formula it writes is one we tested in Notion.
Try it
30%
if(
  prop("Total") > 0,
  min(
    prop("Done") /
      prop("Total"),
    1
  ),
  0
)
Then click the column name, pick Edit property, set Number format to Percent and Decimal places to 0, and
under Show as pick Bar. Rename Done and Total if your properties have other names.
1. A progress bar from two numbers
The simplest kind: a number for what’s done and a number for the total, like pages read out of pages, or runs out of runs planned. Add two Number properties, Done and Total, and a Formula property called Progress:
if(
  prop("Total") > 0,
  min(
    prop("Done") /
      prop("Total"),
    1
  ),
  0
)
Now turn the number into a bar:
- Click the Progress column name and pick Edit property.
- Set Number format to Percent and Decimal places to 0.
- Under Show as, pick Bar or Ring, and choose a color.
In our test, 3 done out of 10 showed 30%, and 7 out of 8 showed 88%. min keeps the bar at 100% when you go past the goal: 12 out of 10 showed
100%. A page with no Total yet showed 0% instead of an error.

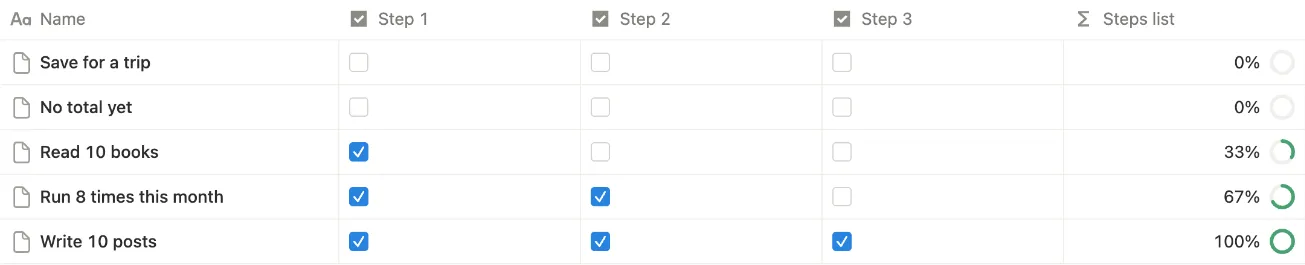
2. A progress bar from checkboxes
When the steps are checkboxes on the page itself, count the ticked ones and divide by how many there are:
[
  prop("Step 1"),
  prop("Step 2"),
  prop("Step 3")
].filter(current).length() / 3
The list in square brackets holds your checkboxes, and filter(current) keeps the ticked ones. Change the names and the 3 to match yours. If you
find it easier to read, this does the same thing, since toNumber turns a ticked box into 1:
(toNumber(prop("Step 1")) +
  toNumber(prop("Step 2")) +
  toNumber(prop("Step 3"))) / 3
Both gave 33% with one box ticked, 67% with two and 100% with all three. Set the display the same way as above. A ring suits a short list well.
3. A progress bar from a to-do list
For a project or a goal with its own to-do list, keep the tasks in a second database with a Done checkbox, and link them with a Relation called Tasks. Then add this formula to the projects:
if(
  prop("Tasks").length() > 0,
  prop("Tasks").filter(
    current.prop("Done")
  ).length() /
    prop("Tasks").length(),
  0
)
It counts the linked tasks with Done ticked and divides by all of them. Our test trip had five tasks with two ticked and showed 0.4, which is 40% once Number format is Percent. A project with no tasks yet shows 0.
No formula at all: add a Rollup property, pick the Tasks relation and the Done property, and set Calculate to Percent checked. Ours showed 40.00% for the same trip. The formula gives you more control, like 0 instead of an empty cell.
4. A bar made of text
Notion’s own bar is the easiest. If you’d like dots or blocks instead, a formula can draw them with repeat. This one draws ten dots, filled for
each tenth that’s done:
lets(
  p, if(
    prop("Total") > 0,
    min(
      prop("Done") /
        prop("Total"),
      1
    ),
    0
  ),
  n, round(p * 10),
  repeat("●", n) +
    repeat("○", 10 - n) +
    " " + format(round(p * 100)) + "%"
)
For colored blocks, wrap each part in style. Swap green for blue, purple, pink, orange, red, yellow or brown:
lets(
  p, if(
    prop("Total") > 0,
    min(
      prop("Done") /
        prop("Total"),
      1
    ),
    0
  ),
  n, round(p * 10),
  style(repeat("■", n), "green") +
    style(repeat("■", 10 - n), "gray") +
    " " + format(round(p * 100)) + "%"
)
The first line inside lets is the same Progress math from step 1, so the text bar works on its own. To use checkboxes or tasks instead, put that
formula in its place, or let the generator at the top do it for you. In our test, 7 out of 8 drew nine filled dots and 88%, since 8.75 rounds up to 9.