


1. Make an Expenses database
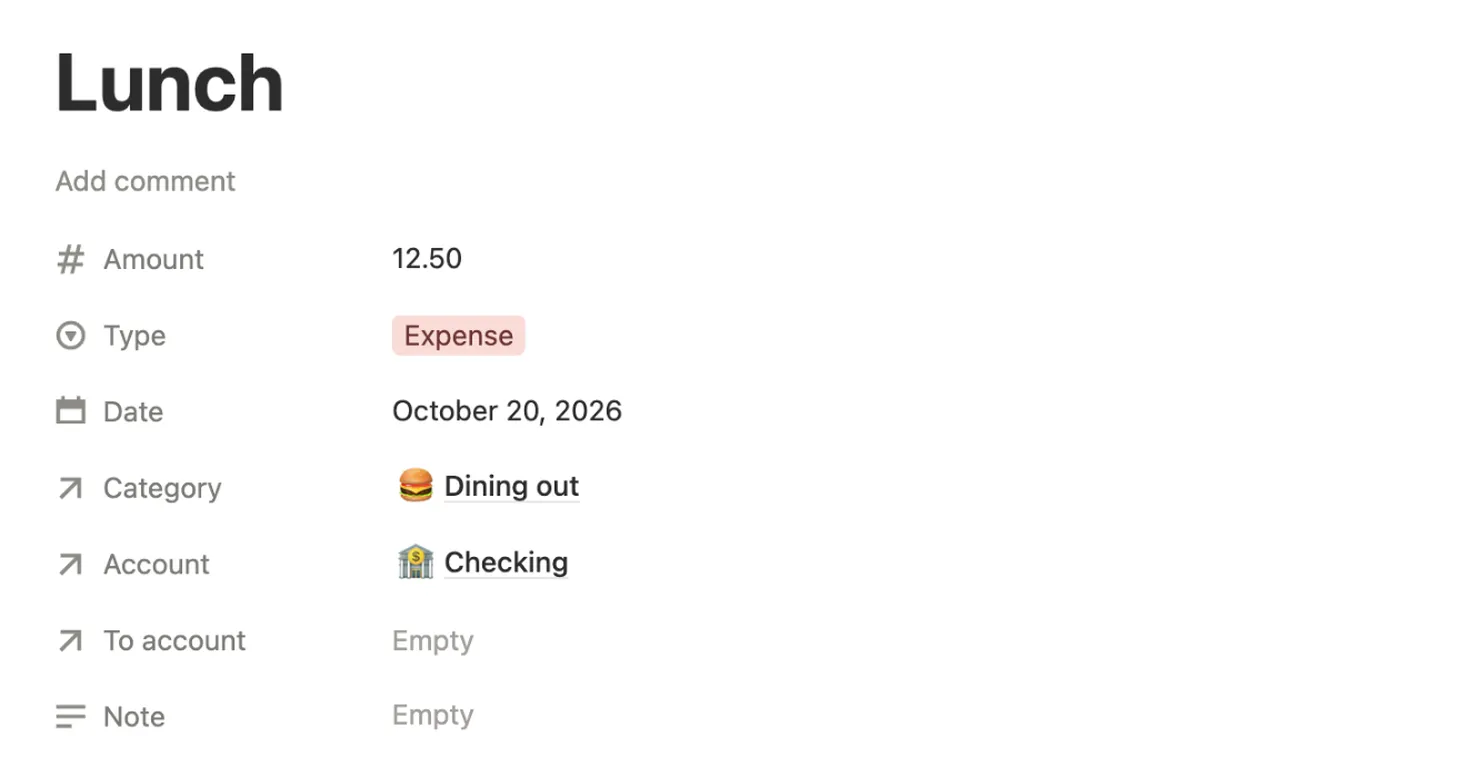
Every purchase becomes one row, so you only ever type four things: what, how much, when and which category.
- Make a new page called Expenses. On it, type
/tableand pick the table option to add a new database. - Add the properties below. Set Amount’s Number format to your currency.
| Property | Type | What goes in it |
|---|---|---|
| Name | Title, already there | What you bought: Weekly shop |
| Amount | Number | What it cost |
| Date | Date | The day you paid |
| Category | Relation | Added in step 2 |
2. Add Categories with a budget for each
- Make a second database called Categories. Add a page for each one: Groceries, Rent, Eating out and so on.
- Add a Number property called Budget and type how much each category gets per month.
- Back in Expenses, add a Relation property called Category, pick the Categories database and turn on Show on Categories. Now each category page lists its expenses.
3. Count only this month’s spending
A plain rollup adds up every expense a category has ever had. To get this month only, give each expense a formula that keeps its amount when it’s from this month and shows 0 otherwise. In Expenses, add a Formula property called This month:
if(
  formatDate(prop("Date"), "YYYY-MM") ==
    formatDate(today(), "YYYY-MM"),
  prop("Amount"),
  0
)
Then in Categories, add a Rollup property called Spent this month. Set Relation to Expenses, Property to This month and Calculate to Sum.
Here’s the difference in our test at the end of October, with one grocery shop from September in the list:
| Category | All expenses | Spent this month |
|---|---|---|
| Groceries | $248.55 | $178.55 |
| Eating out | $164.50 | $164.50 |
| Transport | $60.00 | $60.00 |
When a new month starts, every category goes back to $0 by itself. Nothing to reset, and last month’s expenses stay in the list.
4. Show what’s left, with a bar
Add three formulas to Categories. First, what’s left:
prop("Budget") - prop("Spent this month")Then how much of the budget is used. In its settings, set Number format to Percent and Show as to Bar:
if(
  prop("Budget") > 0,
  prop("Spent this month") / prop("Budget"),
  0
)
And a word you can spot from across the room:
if(prop("Left") < 0, "Over budget", "On track")What the three gave in our test:
| Category | Left | Used | On track |
|---|---|---|---|
| Groceries, $400 | $221.45 | about 45% | On track |
| Eating out, $150 | -$14.50 | about 110% | Over budget |
| Transport, $120 | $60.00 | 50% | On track |
Set Left’s Number format to your currency too. Without it, an overspend shows as -14.5 instead of -$14.50.
Try it
Change the budget or the spending and watch the card update, the same way the formulas above work in Notion:
Groceries
$221.45 left · On track
5. See every category at a glance
- In Categories, click + next to the view name and add a Gallery view.
- In the view’s settings, set Card preview to None, and under Properties turn on Used, Left and On track.
- To see it on your home page too, type
/linkedthere and pick the Categories database.
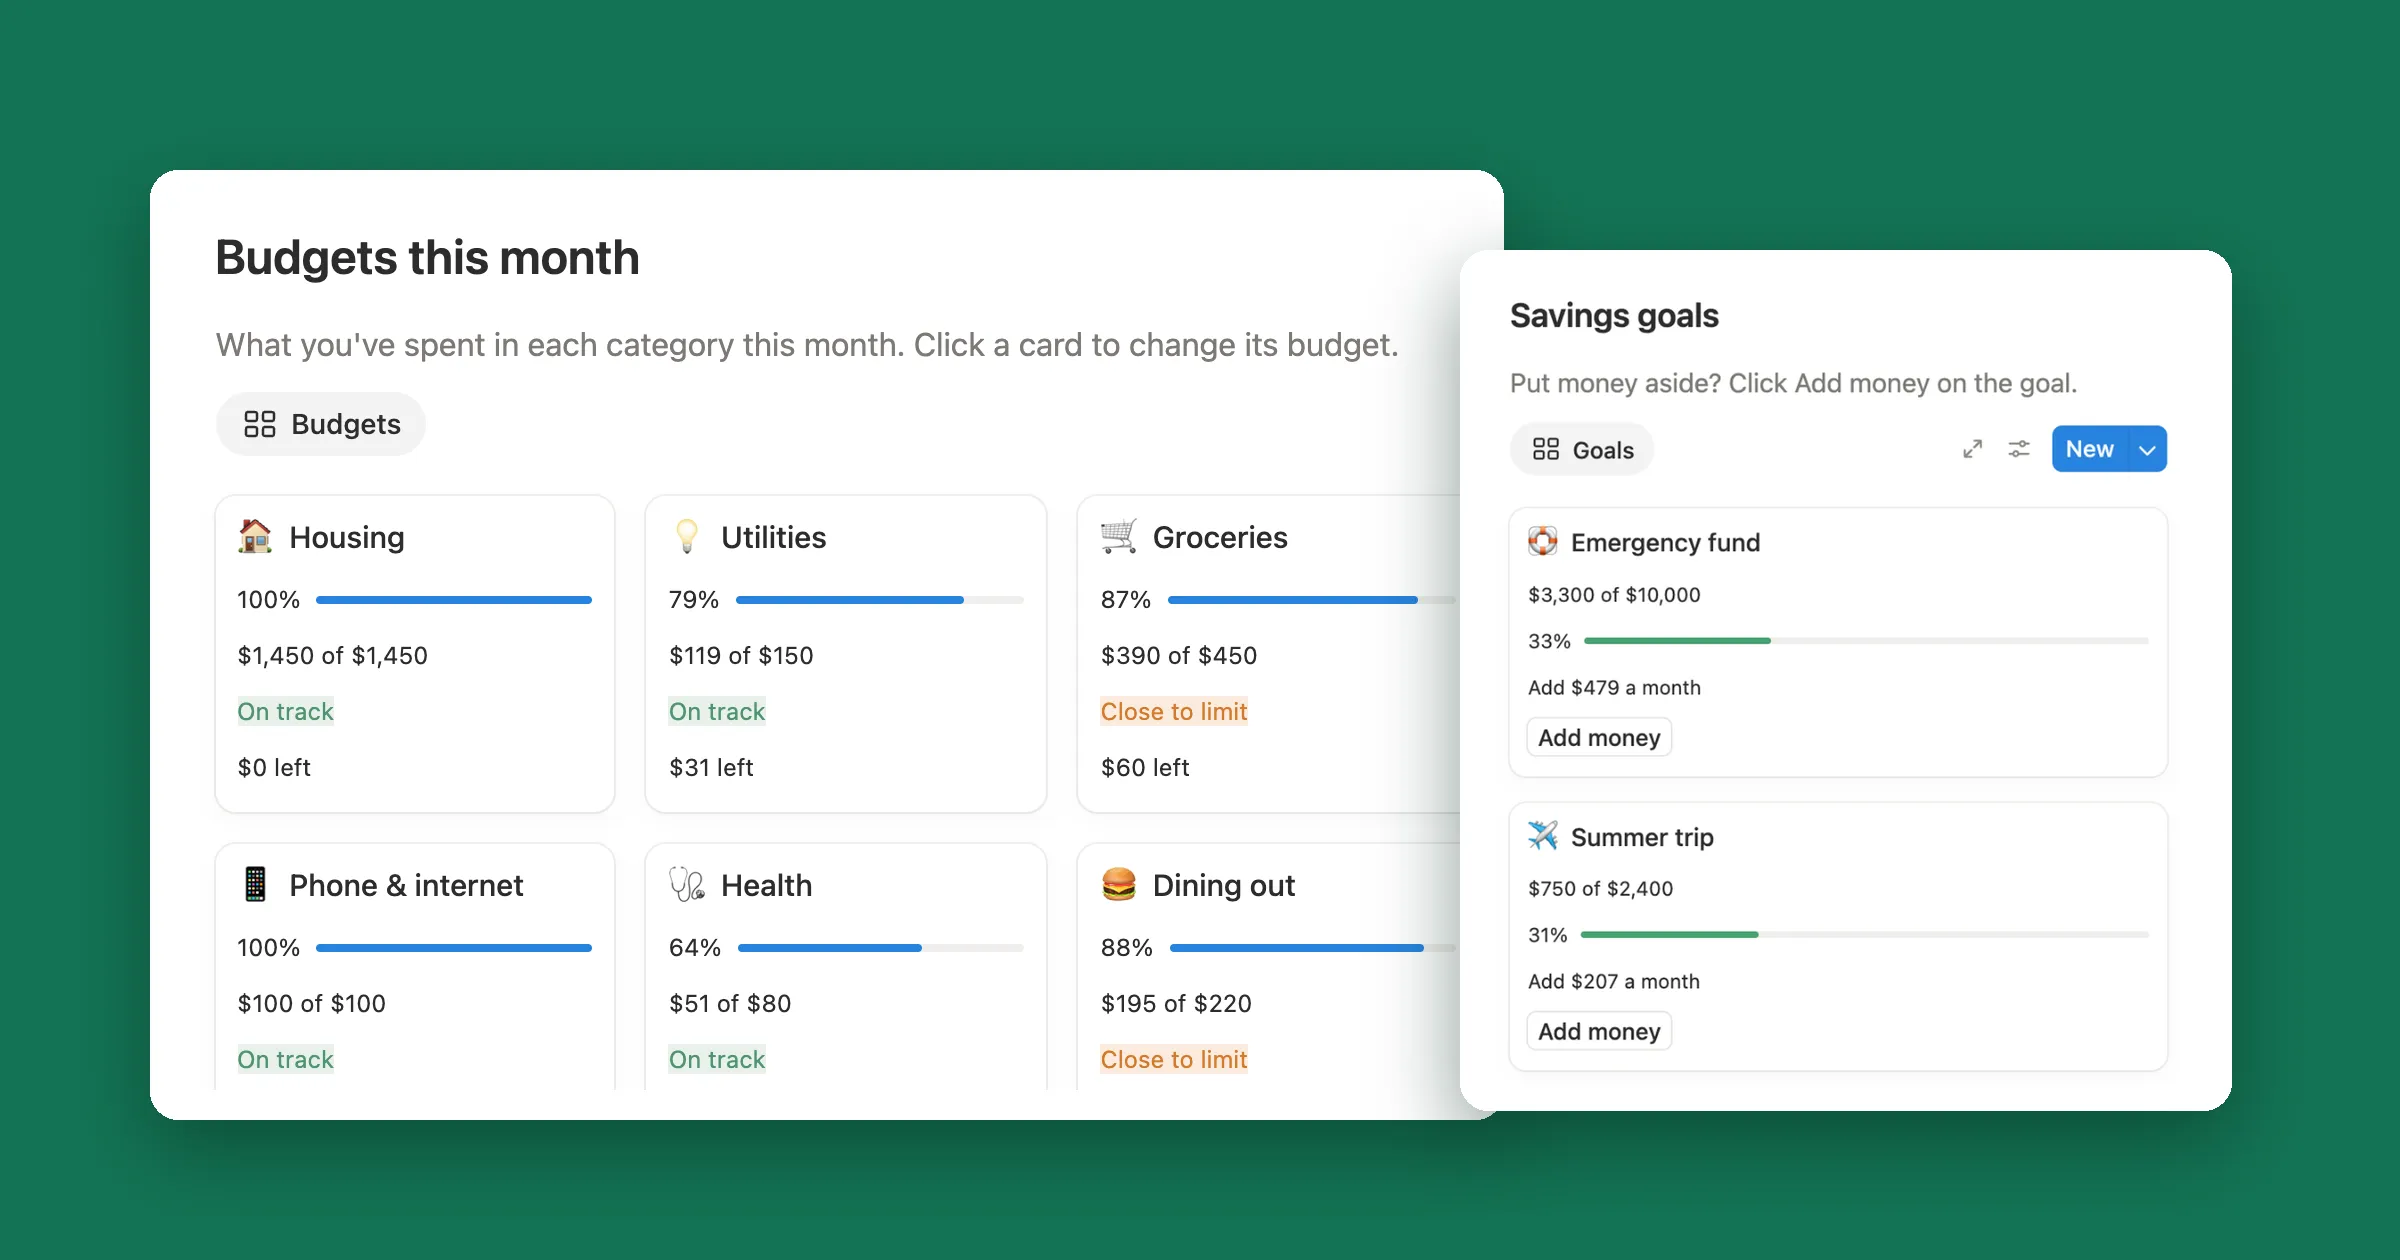
That gives you the cards at the top of this guide: one per category, with a bar, the money left and a quick On track.